Joint Distributions
Each of these plots from my dissertation shows the joint distribution of two very large sets of estimated travel times (>100 million observations). The differences between paired observations are plotted against the values of one of the distributions, showing how travel times may differ from the standard measurement across a range of values.
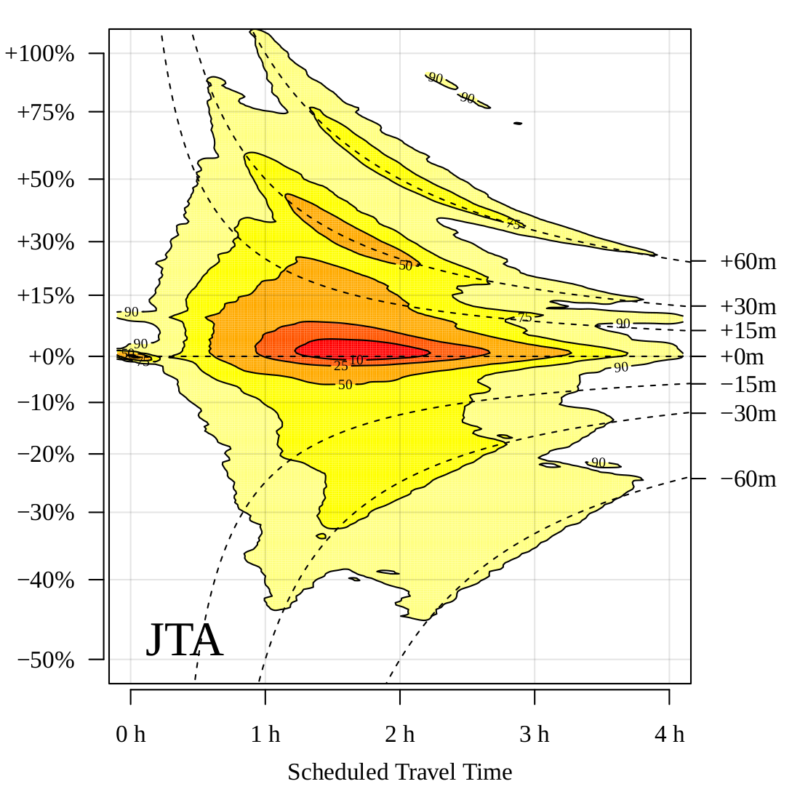
The vertical axes are logged, and absolute travel time differences can be read along the curving lines, labelled at the right.


